XR and Data Visualization
I have a few thoughts on XR and data visualization. First off, I strongly believe the human brain is wired for spatial learning. Over the long evolution of humanity, we have relied on our ability to perceive objects spatially. It makes sense that this would apply to data as well.
The primary goal for any data visualization should be to reveal insights around data. There are many tools that can help us define and highlight features of the data, no matter how simple or complex it is. The way the data is presented can make a big effect in how quickly people can comprehend it and ultimately draw conclusions from it. Imagine using only text data to display the populations for every city in the US. It would be nearly impossible for the human mind to parse all of that information and draw conclusions from it. However, if displayed on a map, and use 3D bar charts to display population, you would immediately see which areas in the US are more or less densely populated.
Should you adopt XR?
Not all data viz is enhanced by the use of XR. In some cases, it adds an unnecessary barrier to being able to view the data. Another question, in many cases it is possible to display 3D data on a 2D screen and simply allow mouse or cursor to view the data from different vantage points. So why do we need XR?
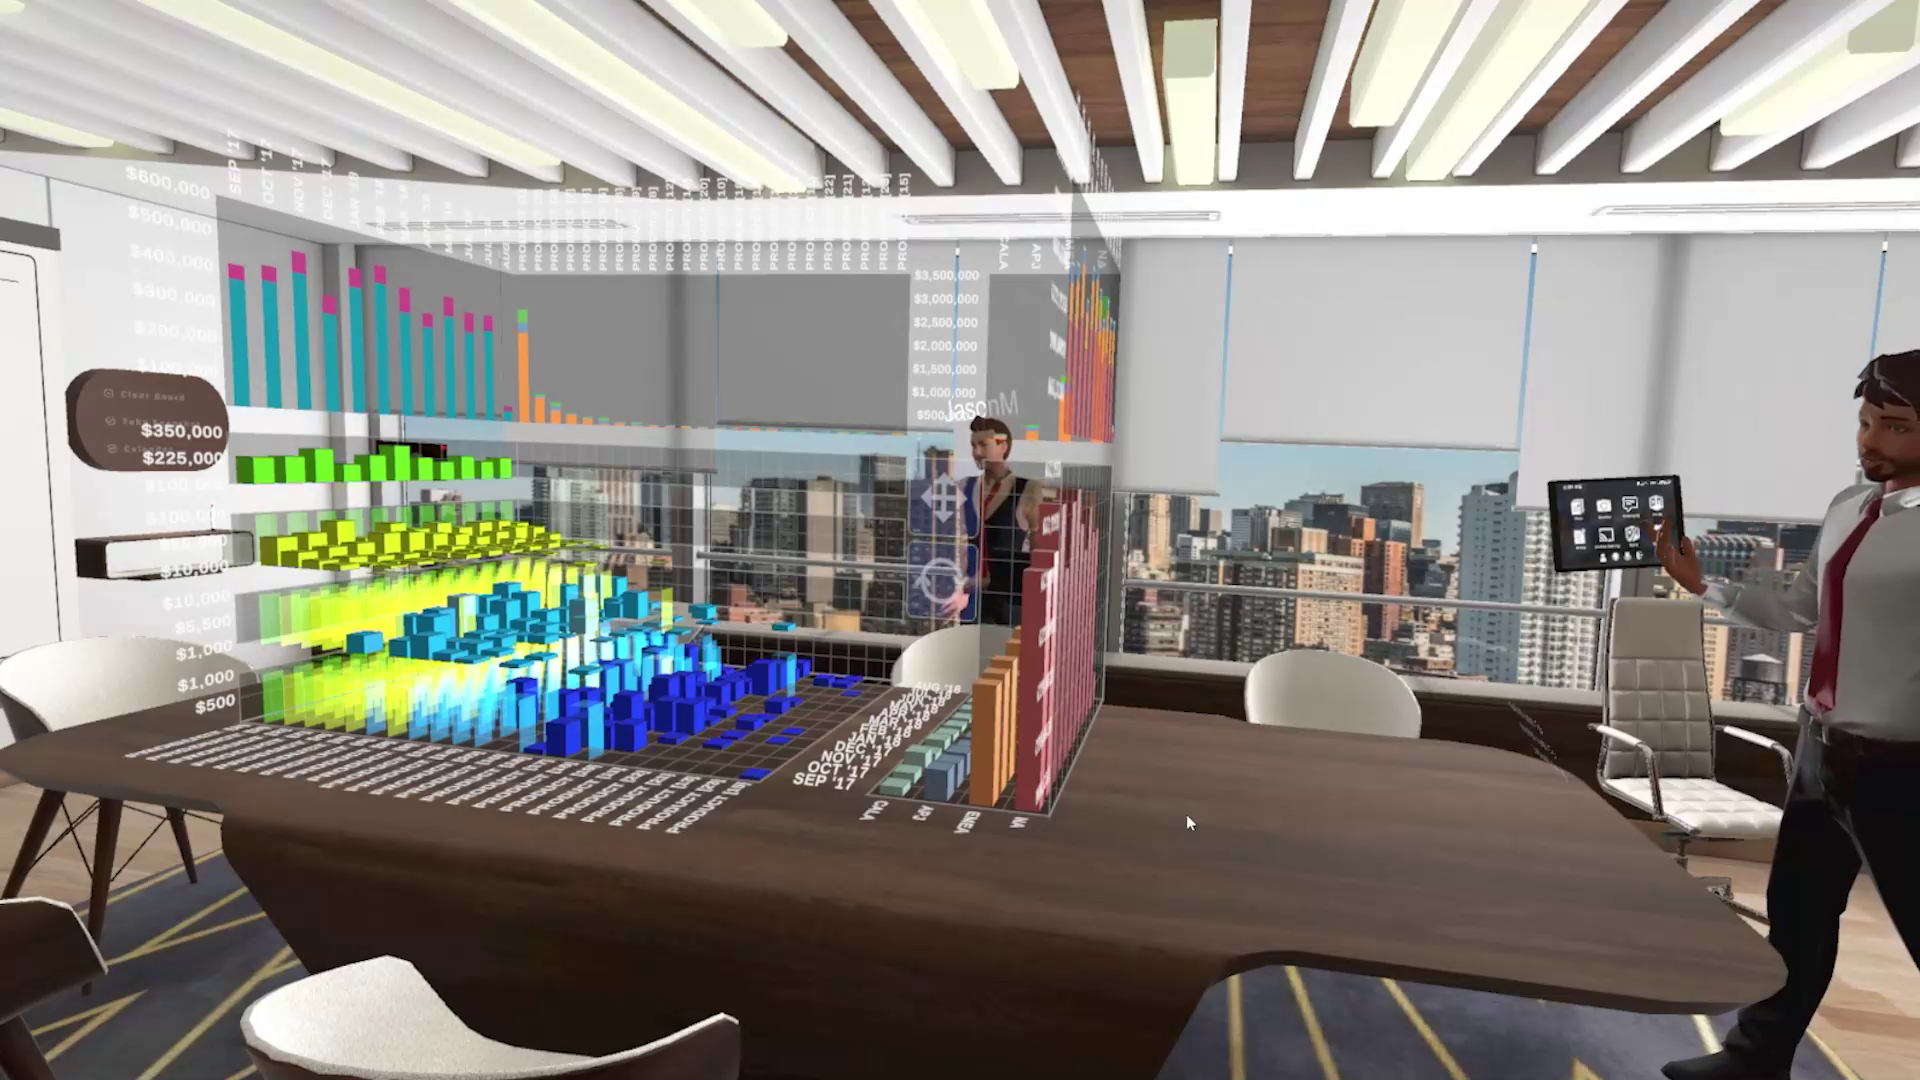
While some data can be viewed on a 2D screen, XR adds a spatial component that can be beneficial for certain types of data. Think about architecture for example, or city planning. It is much easier in some cases to simply move around a space than to click a mouse on a screen. Another example is when collaborating with others. In XR, it is easy to point to a specific point and have everyone know exactly which point you are pointing at. This is not so easy when working on 2D screens remotely.
The point is, there are lots of different examples where XR can significantly improve the way we view and interpret data. It can add insights, and show relations that would not be easy to connect with traditional 2D data viz. If you’re interested in seeing what Spatial DataViz can do for you, I suggest you give it a try!